Tell us about the job
Takes about a minute. No obligation.
A contractor quoting a heat pump installation in Boulder County has to get the sizing right before anything else, because there is almost no idle season to absorb the difference. Homes in Boulder County, CO run heat about ten months a year, from September through June. A heat pump loses capacity as outdoor temperatures drop, so a unit that tests well in mild fall weather can fall short of demand by January. The compressor and the reversing valve carry that load month after month, and a unit sized for a lighter duty cycle accumulates stress faster than its ratings assume. Backup heat selection follows from the same calculation.
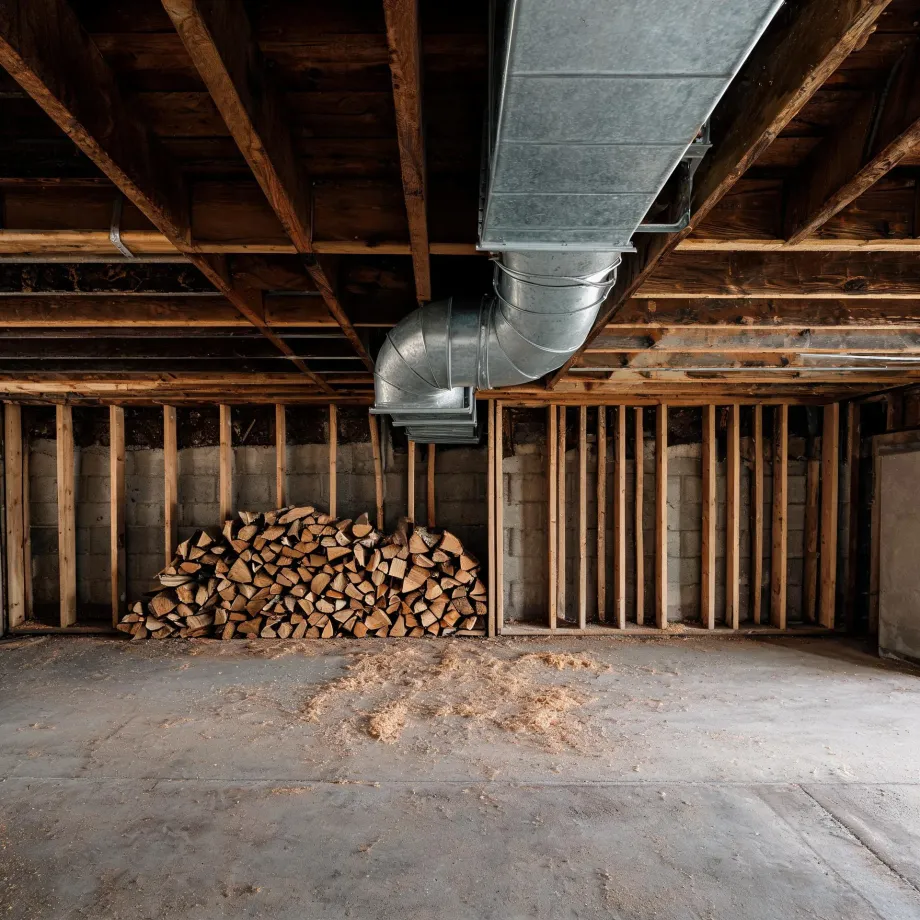
Ductwork laid out for a furnace and central air setup carries specific trunk sizes, branch runs, and return placements that a heat pump does not share. Half the homes in Boulder County, Colorado were built in 1986 or earlier (2020-2024 ACS 5-year). A contractor pricing a heat pump installation here measures and pressure-tests what is already in the walls before settling on a system, because duct geometry that worked for the old equipment may restrict airflow or need rerouting for the new one. The electrical service gets the same review: load calculations for a heat pump differ from what earlier panels were sized to handle.
What Gets Installed With a New Heat Pump
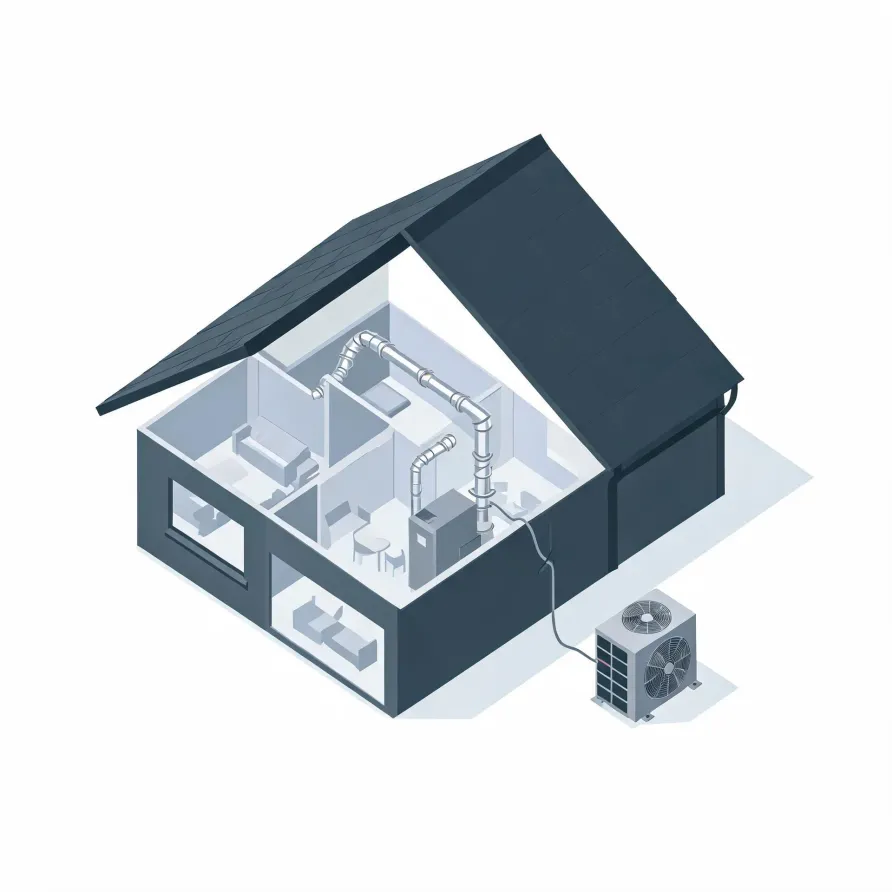
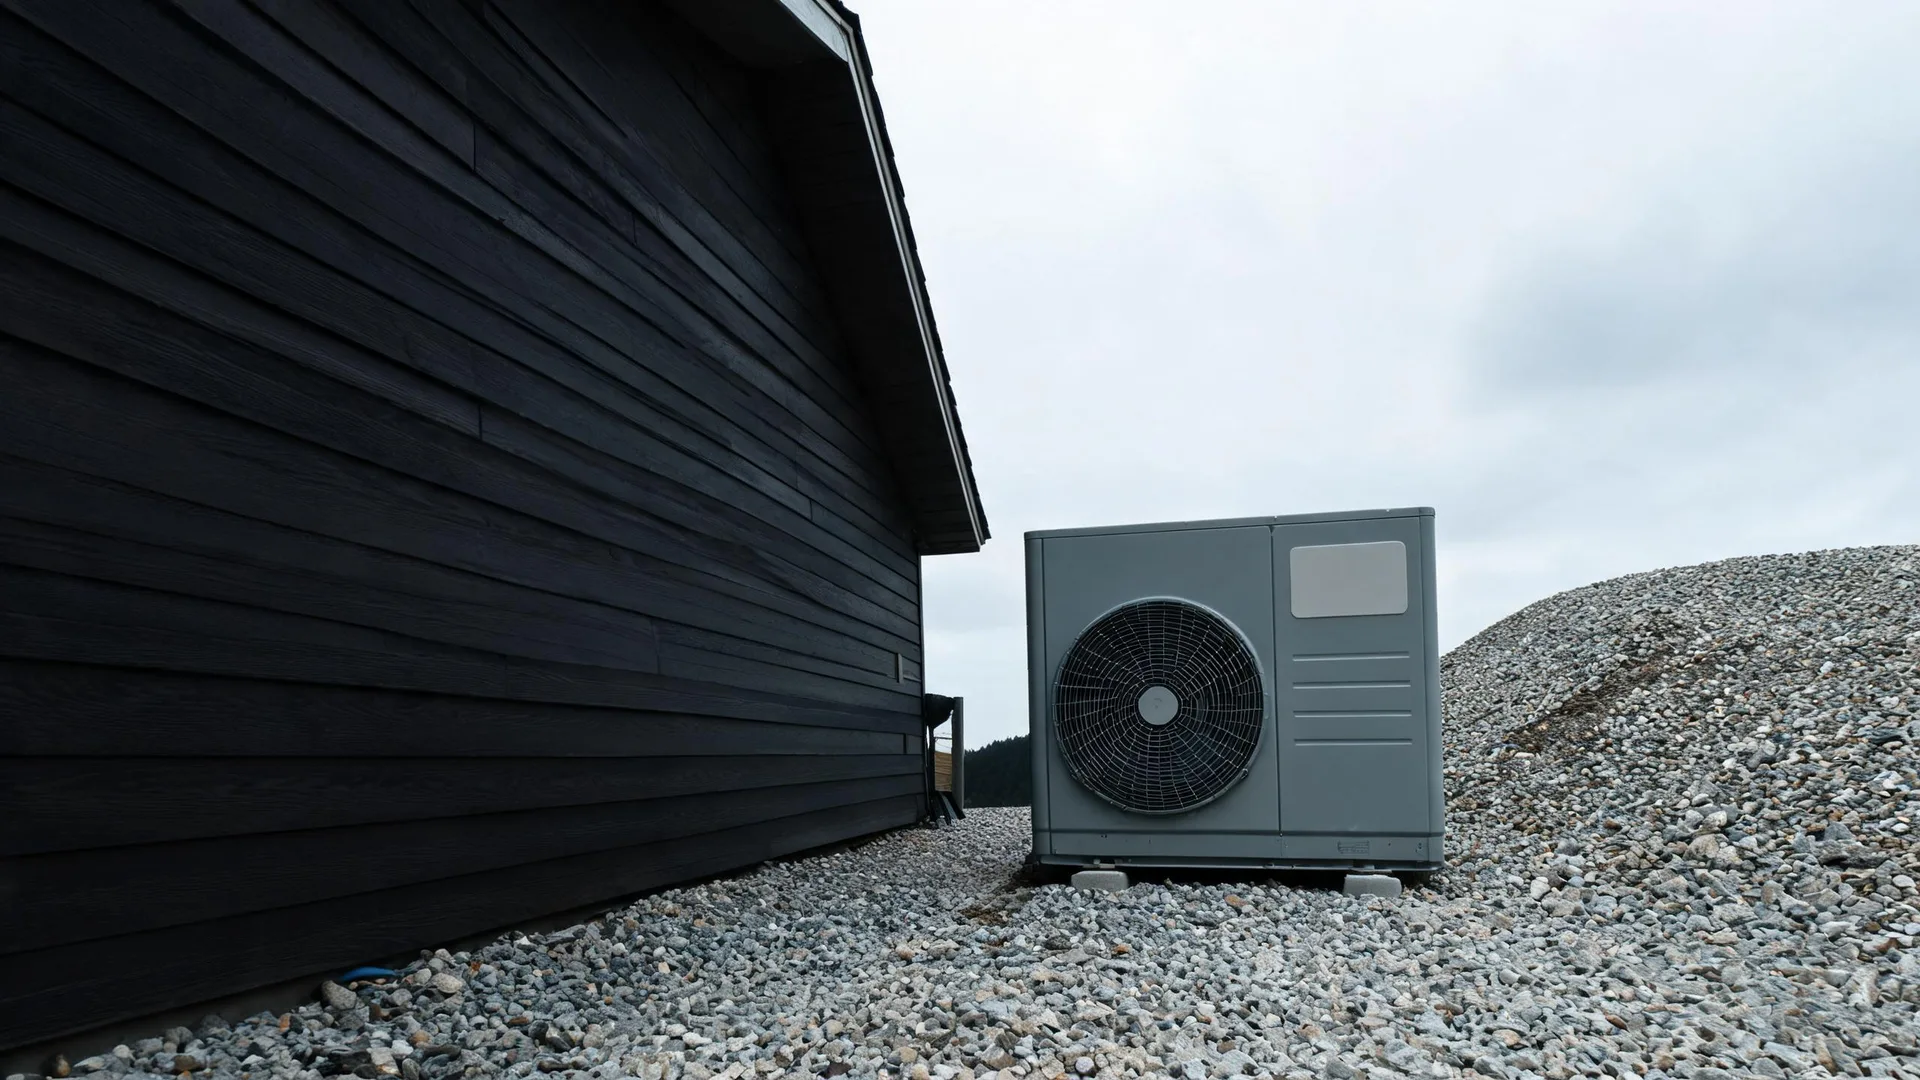
The outdoor unit is the piece most homeowners see first. It sits on a pad outside the house and holds the compressor and the outdoor coil, which together do the heavy work of moving heat. Inside, the air handler mounts in a utility space, basement, or closet and circulates conditioned air through the home.
A refrigerant line set runs between the two units, carrying refrigerant back and forth through insulated copper tubing. The thermostat goes on an interior wall and gives the homeowner control over the system. A condensate drain line runs from the air handler to carry away moisture pulled from the indoor air.
The drawing shows a typical layout, and a licensed contractor determines exactly how each piece fits the conditions of your home.
Get matched in Boulder CountyBoulder County, by the numbers
408 severe weather events were recorded in Boulder County, Colorado between 2015 and 2024.
NOAA National Centers for Environmental Information, Storm Events Database, bulk CSV export, events 2015-01-01 through 2024-12-31.Half the homes in Boulder County, Colorado were built in 1986 or earlier (2020-2024 ACS 5-year).
U.S. Census Bureau, 2020-2024 American Community Survey 5-Year EstimatesBoulder County, Colorado holds 144,729 housing units (2020-2024 ACS 5-year).
U.S. Census Bureau, 2020-2024 American Community Survey 5-Year EstimatesOwners occupy 62.0% of the occupied homes in Boulder County, Colorado (2020-2024 ACS 5-year).
U.S. Census Bureau, 2020-2024 American Community Survey 5-Year EstimatesSevere Weather Events in Boulder County
Heating and cooling loads in Boulder County are shaped by what the sky actually does here. A heat pump sized and installed for this climate handles the real swings, not an average, which makes local weather history a practical starting point.
408 severe weather events, 2015–2024. Source: NOAA National Centers for Environmental Information, Storm Events Database.