Tell us about the job
Takes about a minute. No obligation.
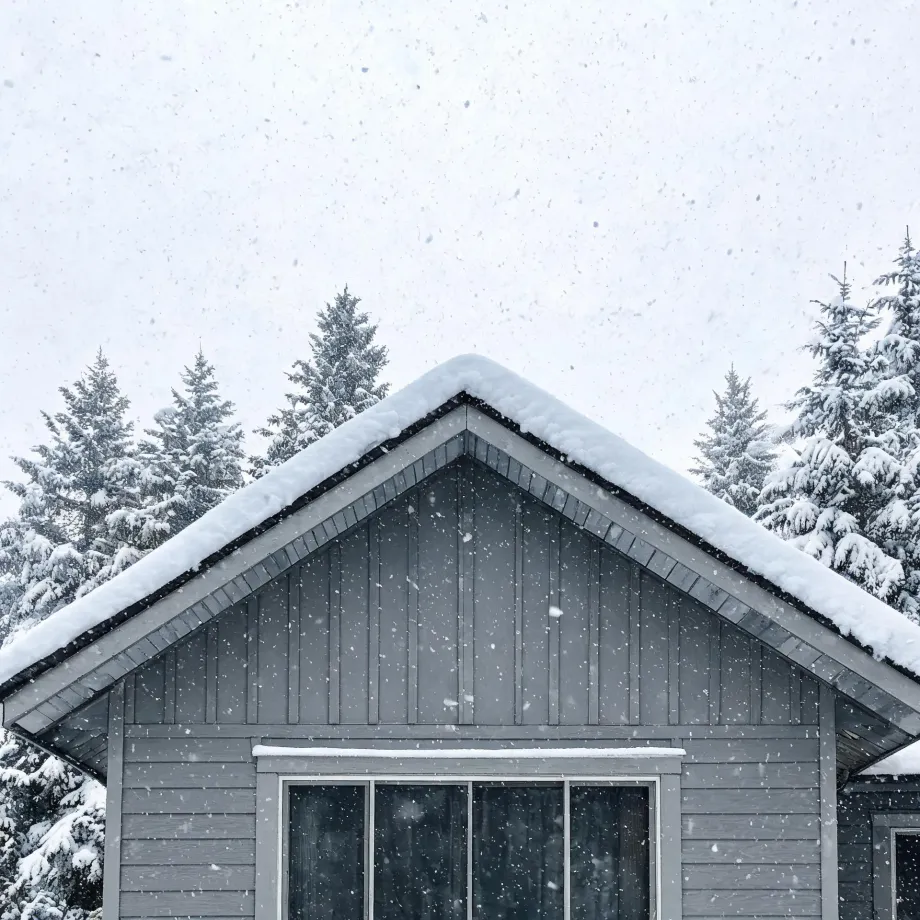
Sizing a heat pump for Hinsdale County starts with the cold end of the range, not the mild part. Homes in Hinsdale County, CO run heat in every month of the year. A heat pump's output falls as outdoor temperatures fall, so a system that looks adequate on a spec sheet can leave a house short on the hardest days. Contractors working an install here have to establish a backup heat plan before they quote, because the primary equipment cannot carry every load on every night. That decision is built into the install, not added later.
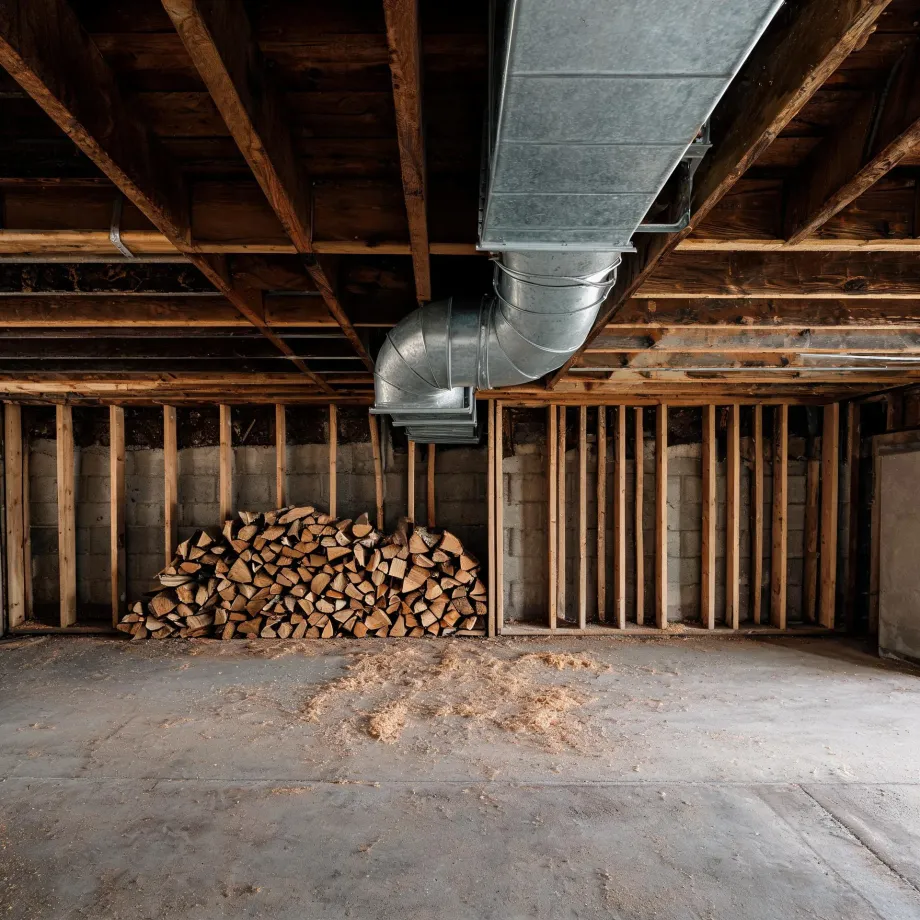
Ductwork laid down for older heating equipment carries assumptions about airflow, routing, and load that a heat pump does not share. Half the homes in Hinsdale County, Colorado were built in 1984 or earlier (2020-2024 ACS 5-year). A contractor quoting a heat pump installation here opens the ductwork question before the equipment question, because what is already in the house was built around a different kind of system. Whether those runs can carry the volumes a heat pump moves is something that has to be measured, not assumed. The electrical service gets the same scrutiny, since the draw of modern heat pump equipment can exceed what older panels were wired to handle.
What Gets Installed With a New Heat Pump
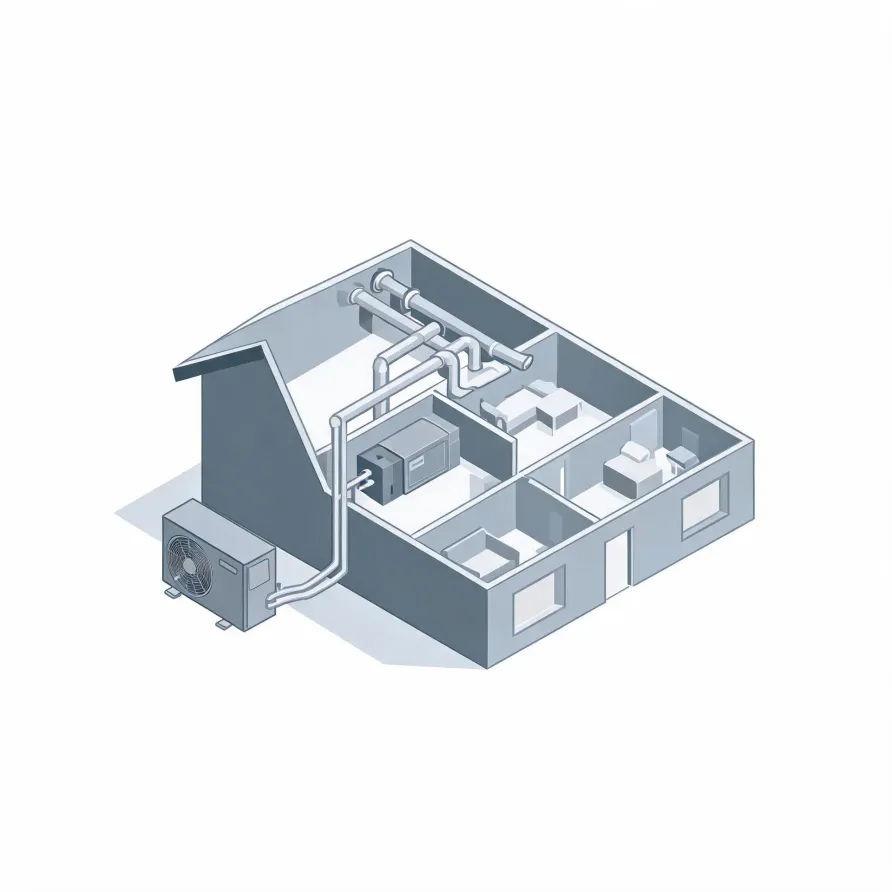
The outdoor unit is the piece a homeowner sees first, mounted on a pad beside the house, and it holds the compressor and the outdoor coil that do the system's central work. Inside, the air handler sits in a mechanical room, closet, or attic and moves conditioned air through the home. These two units are the core of what a contractor installs.
A refrigerant line set runs between the outdoor unit and the air handler, carrying refrigerant through insulated copper lines that pass through the wall or floor. A thermostat goes on an interior wall where it reads the home's temperature and tells the system when to run.
The drawing shows a typical layout, and a licensed contractor determines exactly what applies to this house.
Get matched in Hinsdale CountyHinsdale County, by the numbers
156 severe weather events were recorded in Hinsdale County, Colorado between 2015 and 2024.
NOAA National Centers for Environmental Information, Storm Events Database, bulk CSV export, events 2015-01-01 through 2024-12-31.Half the homes in Hinsdale County, Colorado were built in 1984 or earlier (2020-2024 ACS 5-year).
U.S. Census Bureau, 2020-2024 American Community Survey 5-Year EstimatesHinsdale County, Colorado holds 1,343 housing units (2020-2024 ACS 5-year).
U.S. Census Bureau, 2020-2024 American Community Survey 5-Year EstimatesOwners occupy 76.1% of the occupied homes in Hinsdale County, Colorado (2020-2024 ACS 5-year).
U.S. Census Bureau, 2020-2024 American Community Survey 5-Year EstimatesSevere Weather Events in Hinsdale County
Hinsdale County's climate puts real demands on heating and cooling equipment, and those demands vary with how hard the weather runs from year to year. A heat pump sized and installed for local conditions handles that variation better than one spec'd to a national average.
156 severe weather events, 2015–2024. Source: NOAA National Centers for Environmental Information, Storm Events Database.